Swings #7: Tracking CO2 in the ocean
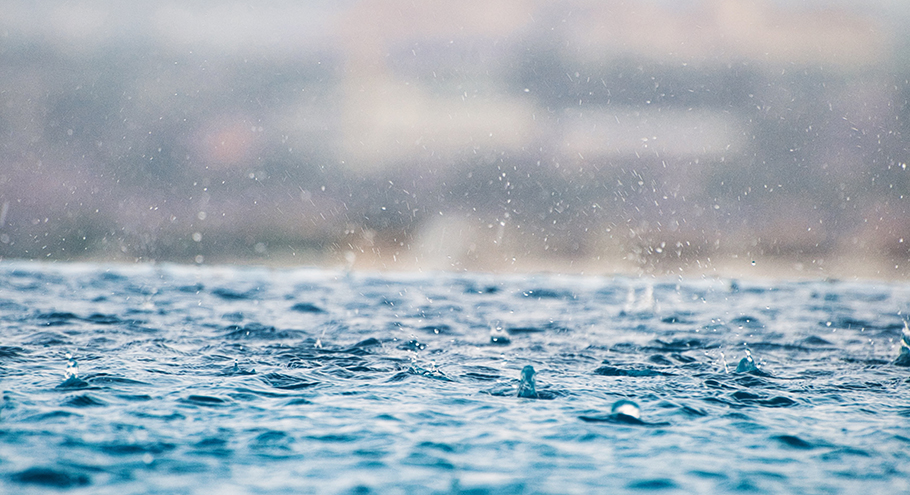
The ocean regulates the climate by absorbing carbon dioxide. Without it, the air would contain 30% more CO2 and the atmosphere would be considerably warmer. On the RV Marion Dufresne, for more than 20 years, the OISO program has been measuring the carbon dioxide in surface and at depth in the Southern Indian Ocean. The objective of the SWINGS expedition is to monitor and understand the evolution of CO2 in this region.
By Victoria Lascaux, translated by Elena Masferrer.
« We don't see any difference since the start of the health crisis. The decrease in emissions due to human activities is small, it is present but too small to be detected in the oceans. »
says Claire Lo Monaco, marine biogeochemist researcher at the CNRS, in charge of the “Ocean Indien Service Observation” (OISO) program team together with her colleagues from the SWINGS project, on board the RV Marion Dufresne.
Unfortunately, a few months of confinement and reduced air traffic are not enough to significantly reduce CO2 concentrations in the atmosphere, and thus climate disruption. The year 2020 was one of the warmest years in 50 years. Scientists therefore remain on guard to understand and assess the capacity of the oceans to absorb it.
« We talk about carbon sinks when the CO2 in the water is lower than the CO2 in the air, the ocean will pump carbon from the air »
sums up Claire Lo Monaco.
This interactivity leads scientists and the media to qualify the oceans as carbon "sinks or sources". The flow of carbon always goes from more to less. As soon as the CO2 in the water is lower than that in the air, the ocean absorbs the latter and directs it towards the depths: this is a "sink". Conversely, for example in warm equatorial regions, the ocean is considered a 'source' when the quantity of CO2 in the air is lower than that in the water. Then the ocean is degassing. The ocean also degasses in "upwelling", areas where deep waters rich in CO2 are brought to the surface by the action of winds. However, if we look at the global balance, the oceans store more carbon dioxide than they release. The vast Southern Ocean alone, south of 35°S, captures about 40% of the anthropogenic carbon that gradually accumulates in all oceans.
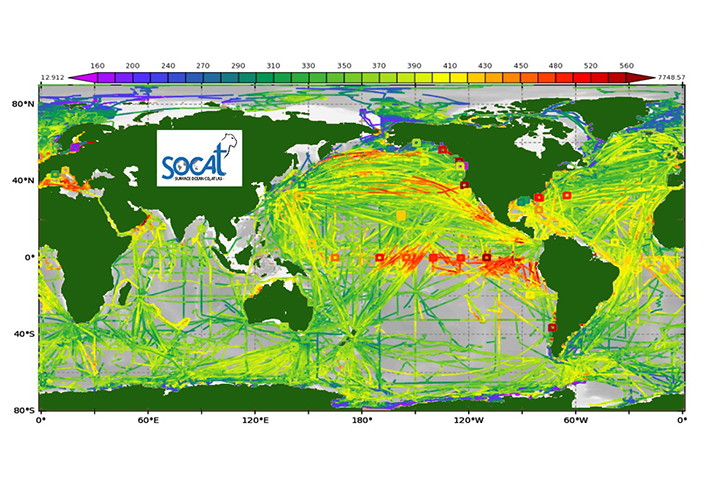
The research carried out within the framework of OISO and SWINGS will enable us to understand the behaviour of CO2 in the South Indian and Southern Indian Oceans in comparison with other oceanic regions. All the data collected during the cruise will be communicated to dedicated databases (SOCAT, www.socat.info) with data from other international teams, which will provide more information on the evolution of CO2 absorption in the oceans on a global scale.
Time passes, the data remain
This year, the SWINGS mission and the OISO program have joined forces to observe the evolution of CO2 in the ocean, completing the data accumulated over more than 20 years by OISO, initiated in 1998 by Nicolas Metzl.
« As the Marion Dufresne is regularly navigating around the Crozet, Kerguelen and Amsterdam islands, it is a great opportunity to study this region every year. The idea was to obtain time series of CO2 observations over the same transects and in a region not sampled by other oceanographic vessels. »
recalls Nicolas Metzl, a CNRS researcher.
Since its inception more than 20 years ago, the OISO program has followed in the footsteps of its predecessors. From the first OISO expedition, the strategy was to take water samples from places that had already been studied by American teams in the 1970s and by the French INDIGO campaigns in the 1980s. The objective was to observe the evolution of CO2 in the seawater from the surface to the bottom at specific locations.
Today, even the Vendée Globe race skippers are taking part in this great sampling effort! This year, some participants, including the skipper Boris Herrmann, took CO2 measurements on the seawater surface with instruments adapted to their yachts. Their data is also transmitted to the SOCAT database.
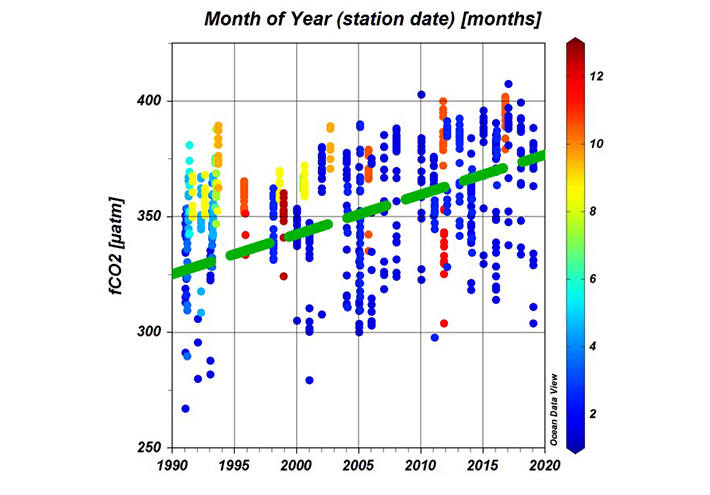
« Thanks to the cumulative measurements, we are seeing a real change. We observe that CO2 is increasing in the ocean, which proves that the ocean is capable of limiting the increase of the greenhouse effect. In a way, this is rather good news, even if it is mitigated by the effect of ocean acidification »
explains Nicolas Metzl.
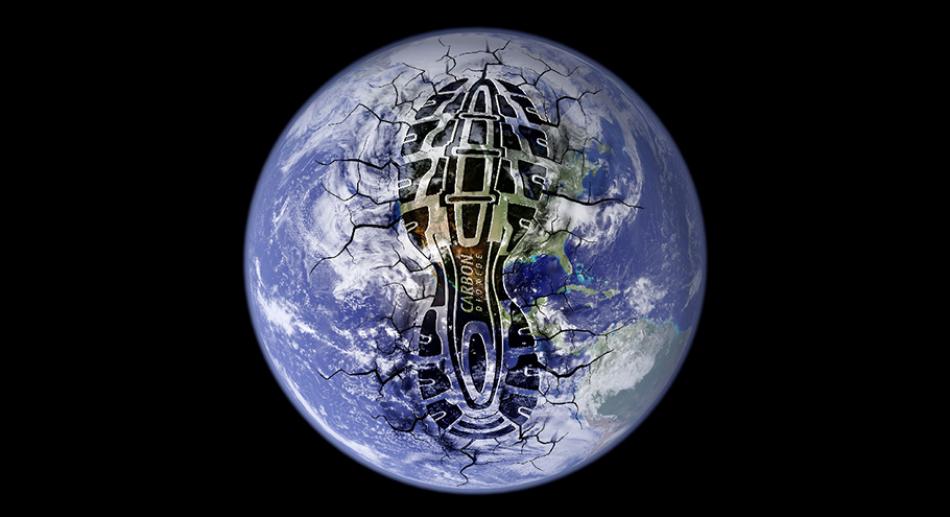
These results confirm that without the oceans, the concentration of CO2 in the atmosphere would be much higher and the air temperature would continue to rise. This good news hides some bad news. Indeed, the CO2 uptake in the oceans leads to the acidification of marine waters. This is the consequence of chemical reactions between the seawater and the carbon dioxide. This results in a decrease in the pH of the seawater. This acidification of the ocean is worrying and could be unfavorable to the development of certain calcifying marine organisms because it induces the dissolution of shells or other calcareous skeletons (corals, phytoplankton, zooplankton).
Slowly but surely
For the moment the ocean has not reached saturation. Ocean waters cover 70% of the planet's surface, and can still capture carbon dioxide emitted by human activities. The oceans are huge, deep but very slow.
« It will require very long time for the ocean to absorb the excess of CO2 present in the atmosphere. If we stop all our CO2 emissions today, it would still take tens or even hundreds of years for the ocean to capture all the carbon dioxide resulting from human activity over the last 100 years »
clarifies Nicolas Metzl
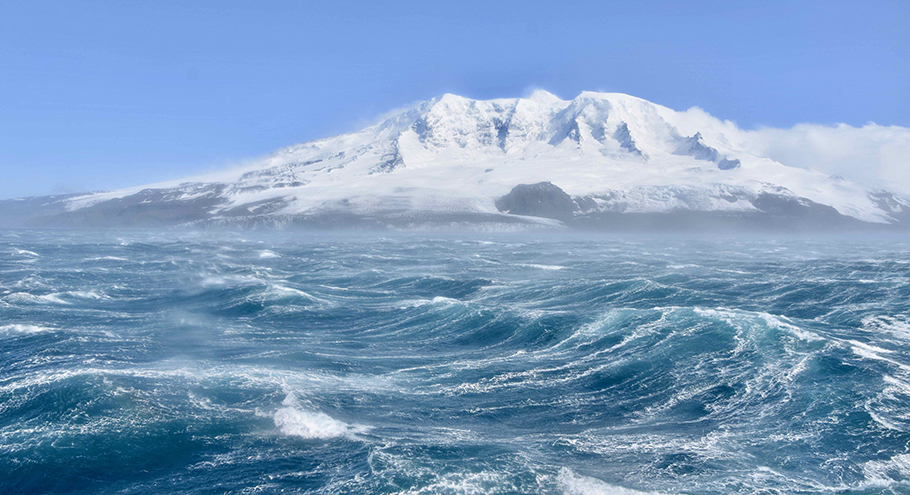
However, in certain specific locations, particularly in the Southern Ocean, carbon dioxide transits more rapidly through the depths. This is the result of strong winds that very quickly mix the surface water with the deep water, causing the CO2 to sink to the bottom 1,000 or 2,000 m. Another phenomenon is dense water formation. Present near the Antarctic continent, the formation of these waters is due to the various salt discharges during the formation of icebergs. This higher salinity causes the water to become denser and heavier, ultimately causing the water to penetrate to the depths. All around the Antarctic continent, these salty and cold waters are transported like a waterfall along the Antarctic continental shelf and invade all the world's ocean floors, causing anthropogenic CO2 to travel to the abysses.
All these various factors affecting the absorption of CO2 by the ocean make it particularly complex to understand the variability of the carbon sink phenomenon. The OISO team has set itself three objectives, as Claire Lo Monaco explains :
« Firstly, we would like to answer the question of quantifying air-sea CO2 exchanges, then find out how much CO2 due to human activities (i.e., in excess of natural levels) is trapped in the various ocean water masses and finally, what the consequences of this excess CO2 are on the acidification of the seawaters. »
"Yo-yo" analyses with high geographical precision
To analyse the ocean, two kinds of observations are carried out: some are done on a continuous basis from the start of Reunion Island and throughout the SWINGS cruise, and others are performed at specific locations, with water samples taken from the entire water column down to the deepest depths.
« During the SWINGS cruise, the relevance of the station depends on the depth of the bottom. For the deepest depths, which are around 5,000 m, it will take about 4 hours to get the rosette back on board, which descends and rises at a rate of 1 metre per second. As soon as the rosette arrives on the deck we immediately collect the seawater »
describes Claire Lo Monaco.
As soon as the vessel stops, twenty-four 12-litre bottles fixed on a CTD-rosette descend. After about 2 hours of descent, the rosette is lifted. During its return, the bottles are stopped at desired depths in order to collect samples in the water column. Once at the surface, the OISO team rushes to take about 2 L of water from the bottles. They have to be quick because the water in the bottles contains organisms (phytoplankton) that consume CO2 as they breathe and therefore influence the concentration of CO2 and nutrients. To inhibit this biological activity, scientists “poison” the samples with mercury chloride in small doses. After carrying out all these manipulations, it is possible to analyse the different properties of the seawater, i.e. salinity, chlorophyll, oxygen, nutrients (nitrates, silicates, phosphates) and an isotope of carbon, carbon 13, which also provides information on CO2 of anthropogenic origin.
Claire Lo Monaco taking seawater samples from the rosette bottles © Laurent Godard
A never-ending cycle
For surface water measurements, a clean seawater pump placed under the vessel's hull at a depth of approximately 7m is used on a continuous basis. Scientists can thus track the difference in CO2 between air and surface water which will regulate the gas exchanges. The direction of the flow is determined by an air-sea imbalance. For this purpose, the OISO team uses several instruments in a laboratory installed on the vessel.
.
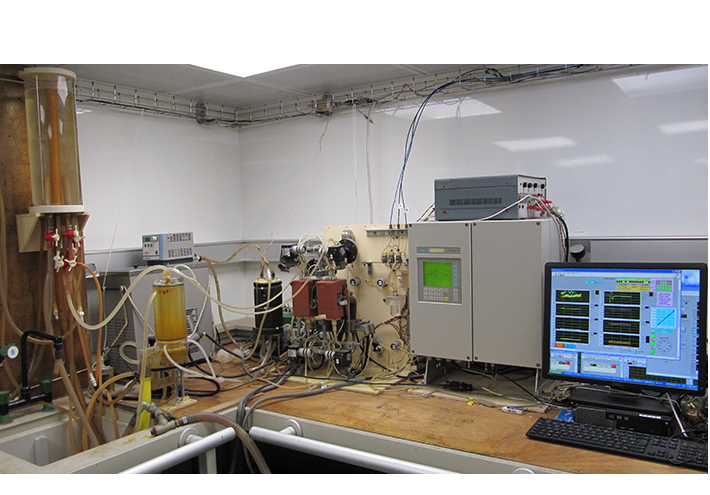
The sea water pumped from the surface starts its way into a "bubbler" which feeds all the instruments for measuring temperature, salinity, oxygen, fluorescence, total inorganic carbon... Then, one of the pipes at the outlet of the bubbler brings the water into an equilibrium cell where it flows along a cone in order to form a thin film in contact with the air that circulates in a closed circuit between the cell and the analyser. Air is also very important for CO2 measurements, for this it must pass through a cold trap at about -35°C in order to dry it completely. The dry air then passes through the analyser which measures the pressure of the carbon dioxide gas balanced with the water. Every 6 hours, the instrument automatically switches to the atmospheric air analysis circuit and measures three standard reference gases to calibrate the instrument.
Finally, to measure simultaneously the concentration of dissolved inorganic carbon (sum of the inorganic carbon species) and total alkalinity (the capacity of water to neutralise an acid) in surface water continuously or water column samples a potentiometric method is used. This is carried out by measuring the pH in a closed cell in which the water sample is trapped, in order to add hydrochloric acid with small increments delivered automatically by a precision burette. This step-by-step addition of acid changes the pH of the sample, which then allows the total CO2 concentration of dissolved inorganic carbon and alkalinity to be calculated.
« We do not keep the samples. We will return to Paris just with the data and with only about 200 litres of wastewater stored in containers. It is out of the question to discharge the poisoned water into the sea. We recycle and treat water at the university »
says Claire Lo Monaco.
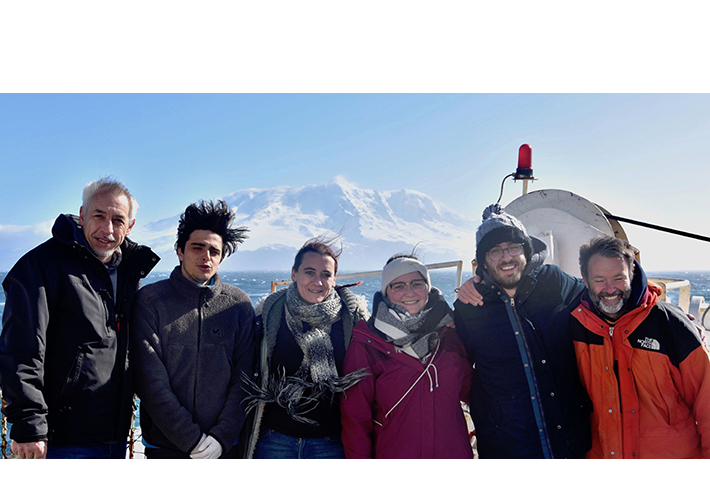
The good mood and the pride of the OISO scientific team will remain in the memories of all the members of the SWINGS expedition.
PORTRAIT
Sara Sergi: PhD experience at sea and in drawings
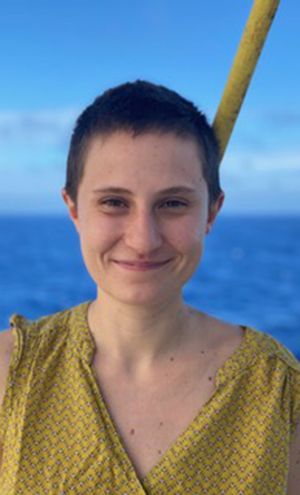
What is your scientific background?
I did a bachelor's degree in applied mathematics coupled with a training in geography. I then did a master's degree in biogeochemistry and physics at the University of Aix Marseille in France. I am now in my third year of my PhD at the LOCEAN laboratory in France. It focuses on the study of the processes that feed the production of phytoplankton in the surface ocean from satellite observations.
What is your greatest scientific pride?
I took part in a project on hydrothermal sources, those sources located at a depth of 1000 or 2000 metres. This project demonstrated that they influence the production of algae at the surface. These springs therefore have an impact on the entire water column.
What is your role on board?
I have two different roles. Firstly, I take part in the water sampling carried out using the rosette. This device allows you to collect water samples at different depths. My other role is to analyze the satellite data in order to better adapt the RV Marion Dufresne's trajectory during the expedition. We use an application developed by Corentin Clerc that allows us to better programme the vessel's stations.
What does a typical day look like?
When it comes to taking samples, I work four-hour shifts, twice a day. I also have to communicate the results of the analysis to the cruise chief scientists and the team on land. Then we test the tool to programme the vessel's route.
What do you like about this adventure?
It's very exciting to be on a vessel for two months and to be so isolated from the land. It's also very rewarding to spend so much time with such a large and stimulating group of researchers. The ocean has always captivated me. Sailing on the most isolated, the most turbulent ocean, is something fascinating.
What do you do to escape on board?
I like to draw. I make sketches of people and things I see. It allows me to keep memories of the expedition.
What books did you take with you?
I took one book that always comes with me. It's Ocean Sea, by Alessandro Baricco. I also have an eReader that I filled with books.
DIARY
The expedition is coming to an end, the sailors and scientists are exhausted. They are using their last reserves of strength to face another storm. Waves of more than 10 metres and a vessel which is not helping anyone to stand upright. Watch out for the fall!
Picture © Laurent Godard
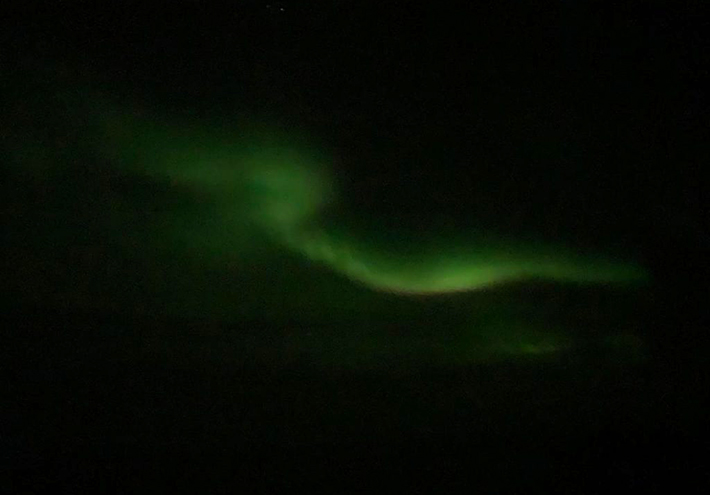
Once the storm has passed, the bruises on their knees and arms are relieved. From now on, it is time for the night and the magnificent spectacle of the Northern Lights.
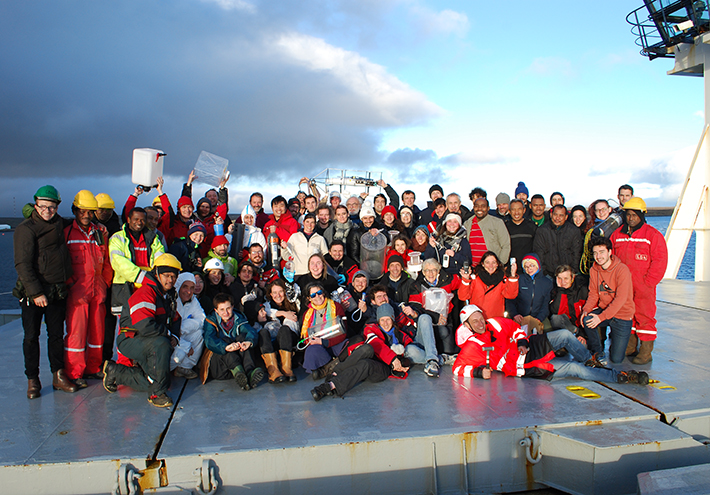
Catherine Jeandel and Hélène Planquette, SWINGS cruise chief scientists are tired but above all happy to have accomplished this oceanographic expedition. The last word goes to them:
« More than 16,000 km travelled, 73 stations occupied and thousands of samples to be analysed.
We took 40,000 L of water, filtered 190,000 L using submerged pumps to collect marine particles and carried out 110 experiments... The fruit of 54 days and nights of work by the 48 scientists on board, this important collection of samples enabled us to achieve and even exceed our initial objectives.
It will allow us to better understand how carbon is sequestered in the South Indian Ocean, how biological activity varies between the tropics and the south, and how water and chemical elements are transported through this transit zone between the Atlantic and the Pacific. The next step is to return these precious samples to 14 different laboratories, and then to proceed with the analysis, a colossal task that will take time and involve many PhD and post-doctoral students.
We are very proud and happy of this collective work and we would like to warmly thank all the members of the Marion Dufresne's crew for their listening and dedication, our colleagues from GENAVIR for their unfailing support and solutions, and of course the 48 scientists for their motivation, enthusiasm and joie de vivre. It has been a great adventure, how lucky we are to have lived it!
We warmly thank all the people who relayed the SWINGS adventure on land, starting with Victoria Lascaux and Anne-Claire Jolivet from the Université Federal de Toulouse in France for the edition and publication of the journal Exploreur and Elena Masferrer and Paule Dossi at LEGOS at the Observatoire Midi-Pyrénées in France for the follow-up of the SWINGS cruise diary website: these two sources of information have fed schools, the press and more generally science communicators, like our colleagues from the CNRS (DR14 and Centrale). Hélène and I invite you to follow the radio programme “La Terre au Carré” on Monday 29 March 2021 on France Inter. »
Team SWINGS : Bruno Hamelin (Université Aix-Marseille), Corentin Clerc (Université Paris, Ecole Normale Supérieure), Corentin Baudet, Hugo Berthelot, Sibylle D’Orgeval, Edwin Cotard, Laurent Godard, Gérard Eldin, Marine Piejus, Maria-Elena Vorrath et Frédéric Planchon (Université de Bretagne occidentale), Stéphane Blain, Damien Cardinal, Coraline Leseurre, Izard Lloyd, Guillaume Barut, Sara Sergi et Rui Zhang (Université Sorbonne), Moustafa Belhadj, Christophe Cassou, Jonathan Fin, Audrey Gueneugues, Catherine Jeandel, Claire LoMonaco, Claude Mignon, Ingrid Obernosterer, Fabien Perault, Emmanuel Saint-Léger, Marc Souhaut et Frédéric Vivier (CNRS – INSU), Wen-Hsuan Liao, David Gonzalez-Santana, Hélène Planquette et Maria Elena Vorrath (CNRS-INEE), Cédric Cotte (Muséum national d’histoire naturelle), Elodie Kestenare (IRD), Marion Lagarde, Pieter Van Veek et Morgane Leon (Université Toulouse III – Paul Sabatier), Natalia Torres-Rodriguez et Marion Fourquez (Institut méditerranéen d’océanologie), Nolwenn Lemaitre (Ecole polytechnique fédérale de Zurich), Isobel Turnbull (Université de Plymouth) Millie Goddard-Dwyer (Université de Liverpool), Thomas Ryan Keogh, (Centre des recherches scientifiques et industrielles de Cape Town), Heather Forrer et Bill Landing (Florida State University)) et Christian Lopes (Florida International University). © DR.